Phase transitions of H2O and other substances, pv diagram for H2O, Reference sources for thermodynamic properties (charts and tables), Properties of wet steam
This tutorial outlines the principal thermodynamic properties of fluids classed as vapours* used in engineering plant, predominantly steam and most refrigerants. Unlike a perfect gas, which is the subject of the next tutorial, relationships between properties of vapours, such as pressure, specific volume and temperature, are not expressible mathematically. Consequently, properties of vapours are determined by experiment and presented graphically or in tables.
(* a vapour is generally understood to be a gas in a state close to or in transition between liquid and gas phases.)
Phase transitions of substances
Figure 1 illustrates on a temperature (°C) vs. specific volume diagram the generalised nature of phase transitions of water and "normal substances".
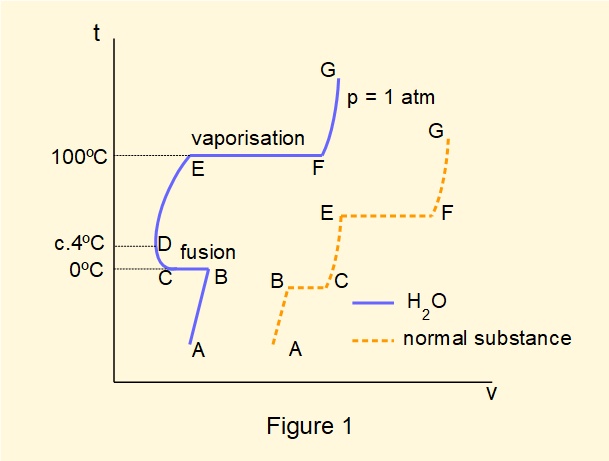
For water at pressure = 1 atmosphere (1.013 bar):
- A to B: solid ice heated from temperatures below 0°C expands
- B to C: ice melts (fusion) at constant temperature 0°C. The heat required for isothermal fusion is called the latent heat of fusion
- C to D: water* contracts when heated from 0°C to approximately 4°C
- D to E: water* expands when heated from 4°C to its boiling temperature at 100°C: at this latter temperature it is called saturated water (* below 100°C sometimes referred to as unsaturated water).
- E to F: liquid water progressively vaporises to steam at constant temperature 100°C. Between E and F composition is a mix of liquid and vapour, called wet steam. At F all liquid has vaporised and is called a saturated vapour and, in the case of water, saturated steam. The heat required for vaporisation is called the latent heat of vaporisation. The mass of saturated vapour relative to the total mass of wet steam is called the dryness fraction or quality of wet steam denoted by \(x\).
- F to G: saturated steam heated above 100 °C expands and is called superheated steam.
Most "normal substances" exhibit the behaviour illustrated in Figure 1 where expansion with increasing temperature progresses immediately fusion is complete. The contrary behaviour of water is often described as an anomalous expansion or contraction
Figure 1 shows phase transitions of water at a pressure of 1 atmosphere. Most processes experience a range of pressures and thus it is useful to illustrate relations between temperature, pressure and specific volume on one diagram. Figure 2 below is a temperature (°K) vs. specific volume diagram for water showing isobars at selected pressures, illustrating important physical transitions that depend on specific combinations of temperature and pressure.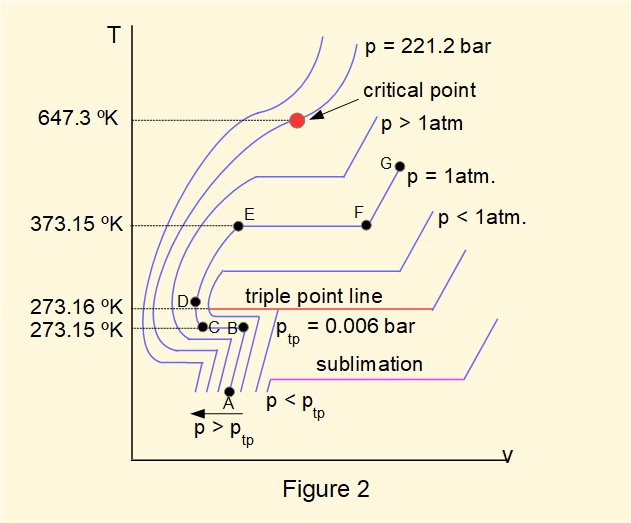
To understand this diagram firstly note the path A-B-C-D-E-F-G replicated from Figure 1 for pressure = 1 atmosphere. Note also that the temperature scale is greatly expanded in the region around 273°K (approximately 0°C).
The isobars indicate that for pressures < 1 atm. boiling temperature reduces and for pressures > 1 atm. boiling temperature increases. At pressure \(p_{tp}\) = 0.006 bar and temperature = 273.16°K a condition exists where ice, liquid water and saturated steam are in a state of equilibrium. This state is called the triple point of water, represented on the diagram as the triple point line.
At pressures \(> p_{tp}\) expansion, contraction and phase changes occur in the manner illustrated in Figure 1. At pressures \(< p_{tp}\) water sublimates from the solid phase (ice) to pure vapour. \(p_{tp}\) represents a very high level of vacuum and as such is of little consequence for most engineering applications.
At and beyond the condition where T = 647.3°K and p = 221.2 bar, called the critical point, water changes state directly from liquid to a high density gas called supercritical steam, used in very high efficiency power generating turbines.
\(\bold {pv}\) diagram for H2O
Figure 3 below is a \(pv\) diagram for H2O covering pressures from below the triple point to above the critical point showing a range of isothermal lines. For practical application this diagram is more useful than the \(Tv\) diagram in Figure 2. Logarithmic scales apply on both axes.
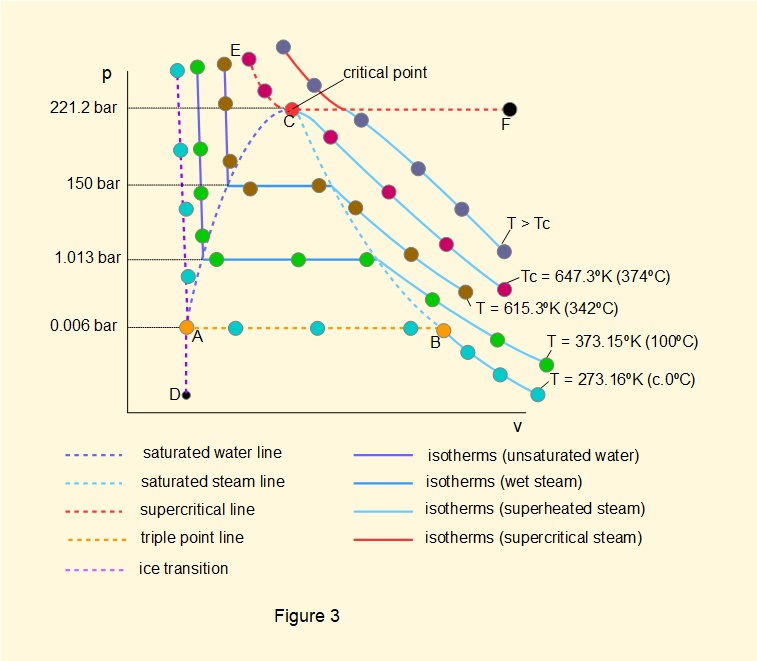
Using terms defined previously the diagram indicates:
- the saturated water line where boiling commences for pressures from point A, the triple point, to point C, the critical point.
- the saturated steam line where liquid is completely converted to vapour for pressures from point B, the triple point, to point C.
- the triple point line AB.
- the supercritical line ECF above which both pressure and temperature meet conditions for supercritical steam.
The diagram also shows selected (colour coded) isotherms through phase changes.
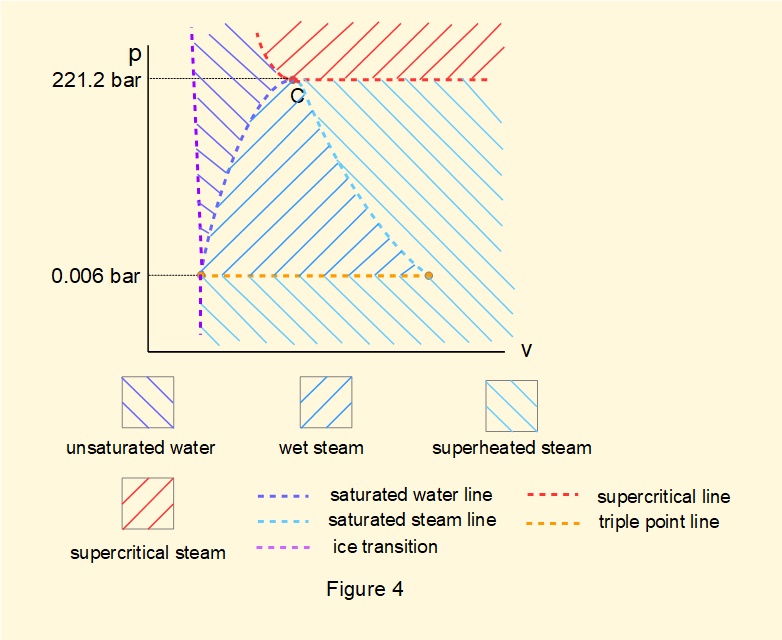
Figure 4 below displays a simplified version of the \(pv\) diagram in terms of phases.
Reference sources for thermodynamic properties
Charts
Thermodynamic properties of water and steam (and other vapours) can be obtained from charts, for example:
- temperature (T) plotted against specific entropy (s), typically displaying isobars
- specific enthalpy (h) plotted against specific entropy (s), typically displaying isobars and isotherms (known as the Mollier diagram)
Tables
Using tables of properties rather than charts is generally more convenient. In times past no self-respecting engineer would be without a set of steam tables.
The first example below shows a format for listing properties of saturated water and saturated steam. \(p\) is the independent variable property that determines all other properties in saturated states. \(t\) is generally used as the independent property where \(p\) < 1 bar. The following subscripts identify the nature of the property:
- \(f\) - saturated water
- \(g\) - saturated steam
- \(fg\) - difference in value between saturated steam and saturated water
- \(s\) - applies to both saturation states
| p | ts | vg | uf | ug | hf | hfg | hg | sf | sfg | sg |
|---|---|---|---|---|---|---|---|---|---|---|
| 1.00 | 99.6 | 1.694 | 414 | 2506 | 417 | 2258 | 2675 | 1.303 | 6.056 | 7.359 |
| 150 | 342.1 | 0.01035 | 1585 | 2456 | 1610 | 1001 | 2611 | 3.685 | 1.627 | 5.312 |
The next example shows a format for listing properties for superheated steam. Data is restricted to temperatures appropriate for superheating at the stated pressure.
| p (ts) | saturated steam | t | 100 | 200 | 300 | 400 | 500 | 600 | 700 |
|---|---|---|---|---|---|---|---|---|---|
| 1.0 ((99.6) | vg 1.694 ug 2506 hg 2675 sg 7.359 |
v u h s |
1.696 2506 2676 7.360 |
2.173 2659 2876 7.834 |
2.639 2811 3075 8.215 |
3.103 2068 3278 8.543 |
3.365 3131 3488 8.834 |
||
| 150 (342.1) | vg 0.01035 hg 2611 sg 5.312 |
v h s |
1.566 2977 5.883 |
2.087 3309 6.345 |
2.487 3581 6.677 |
2.857 3837 6.954 |
The following units are used in the above tables:
| absolute pressure | \(p\) | bar |
| thermodynamic temperature | \(t\) | °C |
| specific volume | \(v\) | m3/kg |
| specific internal energy | \(u\) | kJ/kg |
| specific enthalpy | \(h\) | kJ/kg |
| specific entropy | \(s\) | kJ/kg°K |
| specific heats | \(c_p\), \(c_v\) | kJ/kg°K |
Similar tables are available for commonly used refrigerants.
Acknowledgement for the above data is found on home page.
Properties of wet steam
To determine thermodynamic properties of wet steam, which is a mixture of water and dry steam, recall from above the definition of dryness fraction \(x\):
the mass of saturated vapour relative to the total mass of wet steam
Restate this definition in the following terms: the mass of saturated vapour relative to unit mass of wet steam. From this definition taking unit mass \(1kg\) and specific enthalpy \(h \large\frac{kJ}{kg}\) as an example, enthalpy \(h_{ws}\)* of wet steam with dryness fraction \(x\) can be expressed as follows:
\(h_{ws}=(1-x)h_f + xh_g\)
which expands to: \(h_{ws}=h_f +x(h_g-h_f)\)
giving: \(h_{ws}=h_f+xh_{fg}\)
correspondingly:
\(s_{ws}=s_f+xs_{fg}\)
\(u_{ws}=u_f+xu_{fg}\)
The term \(v_f\) is very small relative to \(v_g\) thus \(v_{ws}\) can generally be expressed as:
\(v_{ws}=xv_{g}\)
(* for clarity we have used the suffix \(ws\) but there is no generally recognised suffix denoting that a property relates to wet steam)
Next: Properties of a perfect gas
I welcome feedback at: